


Sampling Rate, Digital Outputs and PWM | ACE-Lab Operate · Control Engineering
Sampling Rate, Digital Outputs and PWM
Explore how discrete-time control commands are implemented on an Arduino Uno using digital outputs and pulse width modulation, with practical deployment through Simulink and the ACE-Lab.
Contents
Key Learning Outcomes
By the end of this section, you should be able to:
01 Define the sampling interval, Ts, and sampling rate, fs, and convert between them.
02 Relate Arduino Uno output interfaces to the controller and system elements of a control-system block diagram.
03 Implement and explain binary ON/OFF control using a digital output in Simulink and on Arduino hardware.
04 Explain PWM duty cycle and resolution, and distinguish PWM switching frequency from the control-algorithm sampling rate.
Sampling Interval and Sampling Rate
Digital control algorithms do not operate continuously. Instead, the algorithm executes at discrete instants in time. The sampling interval (or sample time), Ts, is the time between consecutive executions of the algorithm. The sampling rate, fs, is the number of executions per second.
(1)As shown in Equation (1), sampling interval and sampling rate are reciprocals. For example, a sampling interval of Ts = 0.01 s corresponds to a sampling rate of fs = 100 Hz. In a deployed Simulink model, the sample time determines how often signals are read, calculations are performed and output commands are updated.
1 s1 Hz0.1 s10 Hz0.01 s100 Hz0.001 s1000 HzThe choice of sampling interval is important. If Ts is too large, important changes in the system may occur between algorithm updates and additional delay is introduced. If Ts is unnecessarily small, processor workload increases and the model may not complete all calculations before the next execution step.
Do not confuse sampling rate with PWM switching frequency. The sampling rate describes how often the algorithm, or commanded duty cycle, is updated. PWM switching frequency describes how rapidly the output pin switches HIGH and LOW within each PWM cycle.Linking Microcontroller I/O to a Control System Block Diagram
In control engineering, a system is commonly represented using a block diagram consisting of a controller, system, measurement and feedback. The Arduino Uno provides the hardware interface needed to implement the control algorithm and connect it to the physical system.
Figure 2: Block Diagram Form for a Control System The controller block (i.e. control algorithm) is implemented in software running on the ATmega328P microcontroller. In this section, the focus is on how the control output is implemented using the Arduino Uno output pins:
- Digital output pins (ON/OFF control) provide binary control commands, such as switching an LED on or off.
- PWM-capable pins provide a variable effective output by changing duty cycle, allowing the power delivered to devices such as LEDs, motors and heaters to be adjusted.
To provide a gentle introduction, the experimental arrangement shown in Figure 3 is considered first. At this stage, no measurement or error signal is fed back to the algorithm. Instead, an open-loop algorithm generates the control input, u, which is applied directly to the system.
Figure 3: Algorithm and System that are to be Initially Considered Digital Outputs
Digital output pins are microcontroller or microprocessor I/O pins configured to drive a binary logic state, typically LOW (0 V) or HIGH (for example 3.3 V or 5 V), to external hardware. They are used to control devices such as LEDs, relays, motor drivers and logic-level inputs on other digital systems.
When configured as outputs, pins source or sink current within specified limits, so load impedance and current ratings must be respected. In control and embedded systems, digital outputs form the interface between software decisions and binary hardware behaviour.
ACE-Lab (Base + Sense): LED (Digital) Exercise
This first ACE-Lab exercise uses an LED as a simple, visible output so that the link between the Simulink model, the Arduino Uno and the control-system diagram can be observed directly. You will create a binary command in Simulink, deploy it to the Arduino and observe the resulting HIGH/LOW output on the hardware.
Why this exercise is important: it establishes the model-to-hardware workflow before feedback is introduced. It also makes digital I/O configuration, binary control and sample-based execution directly observable, providing a foundation for more complex output devices and later closed-loop exercises.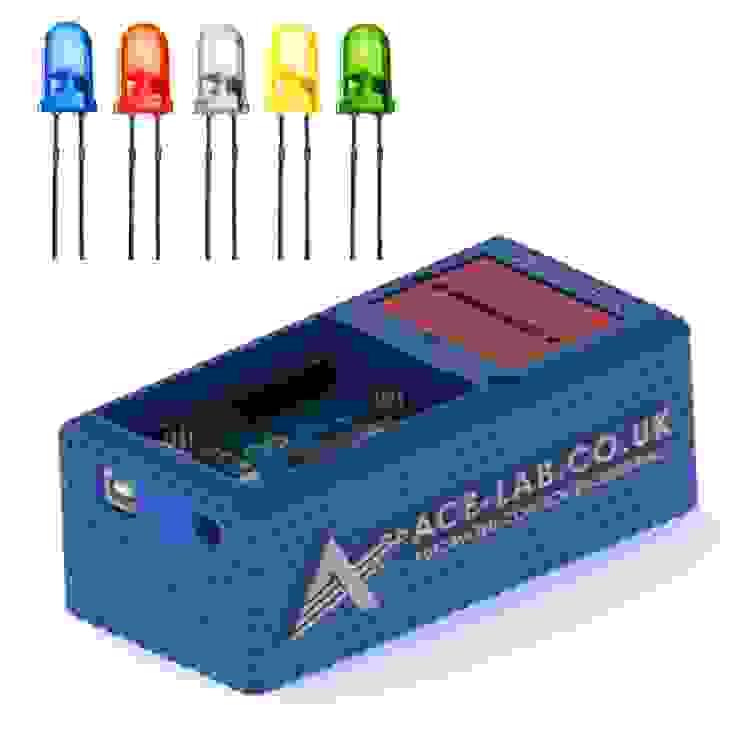 Base + SenseEstimated time: 0.5 hour
LED (Digital)
Create a simple Simulink model to switch an LED on/off via a digital output and deploy it to Arduino.
Open ExerciseReflective Questions
Click on a question block to reveal the suggested answer. The answer will slide out directly below the question; click the block again to close it.
Suggested answer: The algorithm/controller, control output and physical system are present. Measurement, feedback and the error-comparison path are missing, so the arrangement is open loop.Suggested answer: Binary ON/OFF control. The pin commands one of two logic states, LOW or HIGH, corresponding to the LED being OFF or ON.Suggested answer: First, the system cannot automatically compensate for disturbances or changes because the output is not measured. Second, a binary output provides only two command levels, so it cannot directly provide fine adjustment between OFF and fully ON.Suggested answer: An LDR or photodiode could measure LED brightness. The measured brightness could be fed back and compared with a desired value so that the output command can be adjusted automatically.PWM Outputs
Pulse Width Modulation (PWM) is a digital-output technique used to control the average voltage or power delivered to an electrical load by rapidly switching the output between HIGH and LOW states. Rather than producing a true analogue voltage, PWM divides the signal into repeated switching periods. The main control parameter is the duty cycle, which defines the proportion of each period for which the output remains HIGH.
Increasing duty cycle increases the average voltage and power delivered to the connected device. This makes PWM an efficient way of producing a variable effective output using digital hardware, for example when adjusting LED brightness, motor speed or heater power.
The precision of PWM control depends on its resolution. The Arduino Uno uses an 8-bit PWM command, giving 256 command values from 0 to 255. These correspond to duty cycles from 0% to 100%.
Figure 4: Example PWM Signal Illustrating Duty Cycle Variation at a Fixed Switching Frequency. ACE-Lab (Base + Sense): LED (PWM) Exercise
The second ACE-Lab exercise builds directly on the digital-output activity. Instead of commanding only OFF or ON, you will generate a PWM signal in Simulink and vary its duty cycle to change the LED's apparent brightness.
Why this exercise is important: PWM demonstrates how a digital microcontroller can produce a variable effective output without a true analogue output. It provides a practical link between a control command, duty cycle, average voltage and the resulting behaviour of the connected device.
Base + SenseEstimated time: 0.5 hourLED (PWM)
Adjust LED brightness by generating a PWM signal in Simulink and deploying it to Arduino.
Open ExerciseReflective Questions
Click on a question block to reveal the suggested answer. The answer will slide out directly below the question; click the block again to close it.
Suggested answer: The duty cycle is the hardware representation of the commanded output level. A larger command corresponds to a larger proportion of each PWM period spent HIGH, subject to the scaling used in the model.Suggested answer: The average output voltage increases. For an ideal 0–5 V PWM signal, 25%, 50% and 75% duty cycles correspond approximately to average values of 1.25 V, 2.5 V and 3.75 V respectively.Suggested answer: PWM can be generated efficiently using digital hardware and provides controllable average voltage or power without requiring a dedicated digital-to-analogue converter.Suggested answer: Higher resolution provides more available duty-cycle levels, so the output can be adjusted in smaller increments. With 8-bit resolution, 256 command values are available from 0 to 255.Concluding Remarks
This section has linked discrete-time implementation to the Arduino Uno output interface. You have defined sampling interval and sampling rate, related microcontroller outputs to a control-system block diagram, and examined two practical output methods: binary digital output and pulse width modulation.
The ACE-Lab LED exercises demonstrate how Simulink models can be deployed to hardware to generate both ON/OFF commands and a variable effective output through PWM duty-cycle adjustment. A key distinction is that the control-algorithm sampling rate determines how often the commanded output is updated, whereas PWM switching frequency determines how rapidly the output pin switches HIGH and LOW within each PWM period.
These ideas establish the implementation workflow needed before measurement and feedback are added to form a complete closed-loop control system.